 Te Waihora/Lake Ellesmere is internationally significant for birdlife abundance and diversity. A National Water Conservation Order recognises, as an outstanding value, the habitat for wildlife, particularly birds. Some information on the importance of the lake as an area for birds can be found in a recent publication from Forest & Bird – Important Areas for New Zealand Seabirds.
On February 13, 2016, around 50 volunteers and staff from a number of agencies undertook the annual census of wetland birds around Te Waihora. This event is jointly planned and organised by Waihora Ellesmere Trust, the Department of Conservation, Birds NZ and Christchurch City Council Rangers.
The CCC Rangers counted birds along Kaitorete Spit and around Kaituna lagoon and the remaining areas of lake shore, from the Halswell River around to Taumutu, were covered by teams of volunteers and DOC staff. Expertise from Birds NZ members and others is vital to the success of the day.
Some photos from the day are on our Facebook page.
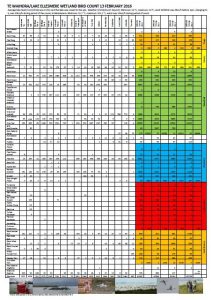
This year just over 41,500 birds were recorded around the lake – the results table can be viewed here The table shows the birds counted in 2016 and, in columns to the right, the corresponding totals from 2013, 2014 and 2015.
The birds are grouped into Shags, Herons, Waterfowl, NZ Waders, Arctic Waders, and Gulls & Terns. The total number of each group of bird species is highlighted in a different colour. For photos and information about each of the species visit the NZ Birds Online website.
Total numbers are a little down this year, and compared to previous years the main difference is in the number of waterfowl, down by over 12,000 from the number observed in 2013. The number of ducks such as mallards are particularly reduced. For 2016, the number of NZ waders is also down from 2014 and 2015, but closer to the numbers observed in 2013. As in 2015, the gulls and terns were also present in lower numbers than in 2013 and 2014. With this type of census, multiple factors such as lake level, weather, availability of food and conditions over the summer will affect numbers on any one day and so this project requires a long term commitment to gathering data.
This graph of the results from the last 4 years shows the changes in numbers of the major bird groupings.
